
Powering Location Data for Good
–Guest post by Karisa Schroeder
By analyzing location data, we can unlock valuable information about people and places to observe and predict change over time. This article provides a recap of the information shared during the Data Con LA 2020 session: Powering Location Data for Good, encouraging data-minded professionals to think beyond what, why, and who – to start asking where.
Ask Where
You may not realize it, but location is a fundamental attribute that can make your existing data more powerful. It provides us with the knowledge of where an event has occurred and can help us to understand the likeliness of an event to occur again. In implementing location data, we move from responsive to predictive thinking by creating information that can lead us into more accurate decision making. In efforts to deploy data for good, powering location data can make a tremendous difference in how we engage with influence.
On global and local scales, we face challenges that require us to determine the best opportunities to act. Just as data is fundamentally spatial, so are the many challenges we are seeking to solve. From climate change to economic security, affordable housing to public health, the key to problem-solving includes knowing where to deploy solutions for the greatest impact. As our resources are often limited, location data can help us to deploy our resources responsibly. Thinking beyond why and what, location data can tell us where and when to act.
A Scientific Approach to Problem Solving
In order to solve problems spatially, we must follow the principles of scientific problem-solving. In doing so, we move ourselves from ideas and/or theories to fact-based decisions. By following a five-step model of spatial problem-solving, we can quickly develop information that can be easily shared with others.

Step 1: Ask and Explore
We must begin by formulating our question, based on our best understanding of the problem. Or in other words, to get the best answer, we must ask the best questions. Learning how to ask where may require a bit of practice. Yet, once you begin to think spatially, the challenge of formulating the questions get easier. Some examples of spatial questions you may ask include:
- How many times has this event occurred in this area?
- Which sites meet our criteria for expansion?
- Where will we have the greatest opportunity to connect with our constituents?
- How likely is the population of this neighborhood to participate?
- What known places are nearby this location?
Within step 1, you’ll start to select the data that corresponds with the question you are asking. Exploring the data will help to open your eyes to aspects of your question you may not have considered and may prompt you to reach beyond your current database. By using location data as a common connection, we can enrich our first party database with third party databases. You may consider a variety of datasets to problem-solve, including: demographics, behavioral, environmental, movement, places, and imagery data.
Step 2: Model and Compute
After you’ve formulated your question and selected your data, you will move into the model and compute stage. We can think of this as our opportunity to transform the data into information. You will want to select the right tools to compute the data and create results. Many spatial thinkers prefer to use location data within a Geographic Information System (GIS) as it allows you to collect, analyze, and manage location data all in one connected system.
Location data can also be modeled in many of the systems already being utilized in our organization, such as your PowerBI or Maps for Office. For those of you running notebooks or other analysis tools, machine learning or artificial intelligence, you can also model location data in these programs. The key is comfortability and confidence. When you feel confident in the accuracy of your tools and the accuracy of your data, the outcome of your modeling will also include this confidence.
Step 3: Examine and Interpret
The output of information may occur in a variety of ways, such as maps, reports, charts, or infographics. As you review the information from your analysis, you’ll want to search for any patterns that may be present and seek to find explanations for why these patterns are occurring. You may find in this stage that the question you were originally asking in step 1 was too broad or too narrow. In this case, you may want to move back to step 1, rethink your data, and compute again. Remember, in order to be accurate, we must be thorough, so taking the time to get it right is important to ensure we are creating the best solutions in our problem-solving.
Step 4: Make Decisions
Review your results and decide how you would like to respond. Think about what the information is telling you and the best way to solve your problem based on this knowledge. If you are making independent decisions, you may decide to end here, or jump back to step 1 to ask more questions. If you are satisfied with your results and need to share your knowledge on with others, you’ll want to proceed to step 5.
Step 5: Share your Results
There are many traditional ways of sharing results. This may include passing along the map or infographic you created, or perhaps you will build an app, report, or article to communicate your message. If you have a variety of different information products to share, you may consider creating a hub for your audience to interact with your information, or, if you desire to tell a story, you can create a StoryMap to incorporate text, video, and graphics, alongside your analysis output.
Whatever direction you choose to present your results, make sure you stay focused on the problem you are attempting to solve and communicate purposefully. By sharing your results with others, you are helping them to gain a deeper knowledge of the problem at hand. Your work will have more influence, should you choose to take the time for storytelling and persuasion. And the beauty of using location data in your problem-solving, means that you will now know where to implement your solution to have the greatest impact.
Take Action
Around the world, organizations are already deploying location data to problem solve. To speed up the process of data wrangling, Esri has created several ready-to-use resources that can help you get started in using location data. With ArcGIS Living Atlas of the World, you can access authoritative data sources and pre-configured apps, maps, and dashboards to support your work. Looking to get inspired? Let’s review a few problem-solving tools that have already been created to power location data for good.

Keep a heartbeat on the planet…
Curious how the world is performing in meeting Sustainable Development Goals (SDGs)? The ArcGIS Living Atlas – Indicators to the Planet dashboard provides you with global updates on key topics such as ocean health, armed conflict, global temperatures, and deforestation. Updated with the latest location data, this dashboard can help you to understand the critical issues facing our world and point you to the areas which need our greatest focus.
Have a closer look at the environment…
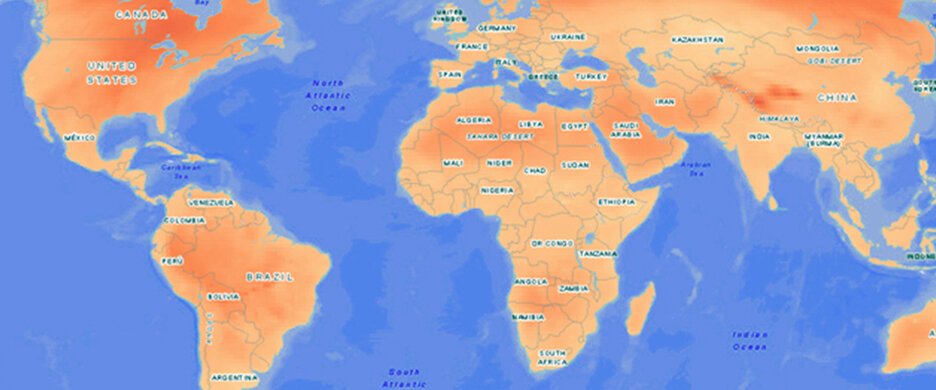
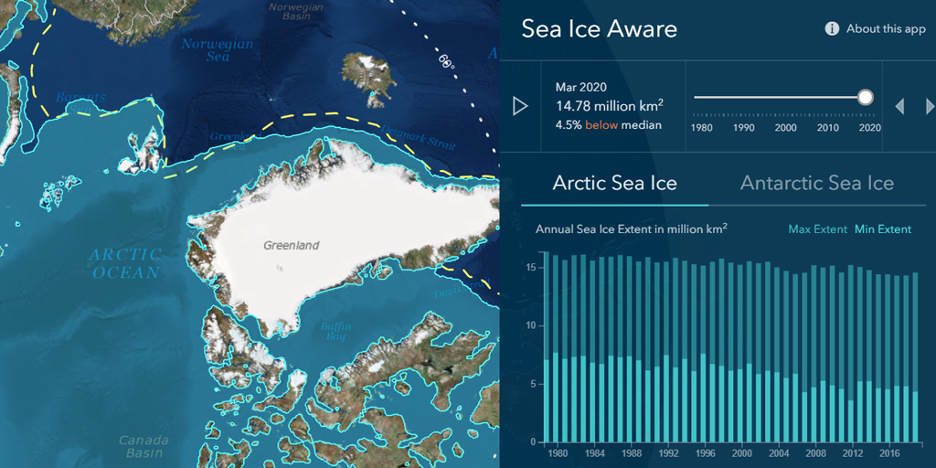
After viewing the Indicators of the Planet dashboard, you may be thinking about the different impacts the environment has on your local neighborhood. The USA Wildfire Activity app displays a live feed of current wildfire locations, showing burn acreage and containment. If air quality from the fires is a concern, you’ll want to check out the new Air Quality Aware app. This app utilizes location data from EPA AirNow, NOAA, and the US Census to communicate how air quality changes throughout the US and how it affects at-risk populations. For those of you interested in rising sea levels, the Sea Ice Aware app provides an information resource on Arctic and Antarctic sea ice extent, providing monthly change data and historic sea ice data – dating back to 1979.

Empower change locally with maps…
If you are looking for prepared maps to research and respond to local issues, the Esri Maps for Public Policy app offers a variety of maps to choose from. Explore maps that focus on social equity and health, economic opportunities, public safety, transportation, and infrastructure. Make a collection of maps and share easily on social or through email to spread the word on why your cause matters and where to act to make a difference.
Act on critical issues…
Keep a thread on Covid-19 and access maps, solutions, and resources powered by location data. The Esri Cov19-19 Hub provides access to a map gallery of ready-to-deploy solutions from around the world. See how communities plan to reopen, track the rate of occurrence, or see how many homes are disconnected in this now virtual world. Interested in deploying location data for social justice? The Esri Racial Equity Hub has the data, tools, and workflows to help you get started.
Keep the Conversation Going
Now that you understand the value of location data, I encourage you to share this information with others. Think about a problem that you face in your organization or neighborhood and practice formulating a question that can be answered using spatial problem-solving. If you are active on social media, share and follow along with @livingatlas and @esridataLS. Together, using location data and the right tools, we can develop precise solutions to better our world.

About the Author
Karisa Schroeder manages Esri's Data and Location Services marketing. She holds an MBA in Location Analytics. With over ten years of marketing experience, Karisa is passionate in exploring big ideas through scientific practice and helping others to see the value in applying location data for accurate decision making.
About Esri
Esri, the global market leader in geographic information system (GIS) software, location intelligence, and mapping, offers the most powerful geospatial cloud available, to help customers unlock the full potential of data to improve operational and business results.